With the GE2020 now over, we know the PAP has been returned to power safely with a more than comfortable supermajority margin. Prior to polling day, PAP candidates raised the possibility of PAP losing their majority in a freak election and the alternative side stating the opposite scenario.
I googled around but never actually found any article that examines the risk of a Freak Election with respect to the Group Representation Constituency (GRC) system. Could the GRC system possibly aggravate the risk of this PAP-wipeout freak election scenario against just having all Single Member Constituencies (SMC)?
Due to the graphical density of this post, this post might not display properly on mobile browsers. I suggest that you view this on a PC or tablet.
What is a GRC?
According to the Wikipedia article on GRCs:
A group representation constituency (GRC) is a type of electoral division or constituency in Singapore in which teams of candidates, instead of individual candidates, compete to be elected into Parliament as the Members of Parliament (MPs) for the constituency… at least one of the MPs in a GRC must be a member of the Malay, Indian or another minority community of Singapore.
… The original stated purpose of GRCs was to guarantee a minimum representation of minorities in Parliament and ensure that there would always be a multiracial Parliament instead of one made up of a single race.
The purpose of this post is however not to investigate the official reasons. It’s to see how GRCs can relate to Freak Election results.
Definition of Freak Election
There is no official definition I can find on this term “Freak Election”.
Therefore I shall use the context and theory put forward by Cherian George (CG) in his book Singapore, Incomplete: Reflections on a First World nation’s arrested political development (2017).
To be worthy of the name, a freak result is one that the majority of voters didn’t want. This outcome is possible because voting is susceptible to coordination failures. People vote based partly on imperfect knowledge of how others will use their ballot. Those expectations may not be accurate.
In either case, if you and others like you assess the mood wrongly, you might end up using your vote in a way that goes against your own wishes. You all overestimate the PAP’s strength, vote opposition, and contribute to ousting the PAP—to your horror. That’s a freak election. It could also work the other way: you overestimate the opposition tide, give your vote to the incumbent party, and end up with a decimated opposition, which isn’t what you wanted.
I don’t see a feasible way to get evidence of the thought process of voters as we do not have opinion polls. So I shall utilise CG’s theory in this post.
CG does not discuss the impact of the Freak Election which is one of the factors of risk. Nevertheless, I shall consider that as well.
What is risk and how to measure it?
With the above definition in mind, we still need some kind of metric to measure the risk of a freak election:
Risk is a combination of 2 factors:
Risk = Likelihood x Impact
In this context, likelihood is the probability of the freak election happening and impact is the possible damage that may occur should such a freak election occur.
With this risk equation in mind, I propose 2 sets of metrics for the Likelihood and Impact. Both factors will vary depending on how the GRC system is implemented.
Impact metric
A certain % of seats change is required to shift an alternative party from being in the best minority situation to being able to form the government.
The smaller the % of seats the alternative holds in the penultimate election, the greater the repercussions of a freak result as it indicates that the alternative party is less experienced and prepared to take over.
Therefore, the greater the seat shift required, the more impactful this transition will be.
Likelihood metric
This metric is based on the % shift in a national voting trend between the penultimate election to when the alternative gains power. Or to put it in a simpler way, the % change in voting trend required to incrementally change the seat allocation in Parliament.
The higher % shift means a greater swing uncertainty the average voter will feel in gauging the behaviours of others to get the result they want.
The smaller the % shift to change on a per seat basis, the more precise a voting pattern will be able to approximate the seat allocation in Parliament which voters desire.
The lowest likelihood scenario is intuitively a political system that uses a proportional representation as the voting pattern will exactly determine the seat allocation hence there is less variability and surprise. However, Singapore uses the first-past-the-post (FPTP) system so this situation does not hold.
The greater the uncertainty of how one’s vote can translate to the desired result, the greater likelihood a freak result may happen.
Rules of the game
In this post I’ll try to run some hypothetical scenarios with simulated voting outcomes illustrated in simple diagrams. I’ll make the following assumptions in this fictional representation of Singapore:
- There are only 2 parties which I call Incumbent vs Alternative
- We have 15 SMCs but which can be grouped under varying-sized GRCs.
- Voting trends will shift equally among all constituencies as the election cycles go by.
- The only difference is the existing base of voters who support a particular party in each SMC.
Now these assumptions obviously do not match the real world but I’m just simplifying the problem and holding constant as many factors as possible.
In all the scenarios, the average vote share for the Alternative increases slowly due to the shifting voting trends until it gains the majority seat share and we get our “Freak Result”. This matches what happens in real life as the PAP vote margin has gradually decreased over the decades.
Let’s run some scenarios!
0. Establishing an initial level of support
| Incumbent | Alternative | |
|---|---|---|
| Seat Share | 1 | 2 |
| Popular Vote | 3 | 4 |
All 15 SMCS are currently held by the Incumbent party although each SMC has varying levels of support. We have 15 equally-sized constituencies which have these initial base voters spread 2% apart at these percentages for the Alternative Party: 20, 22, 24, 26, 28, 30, 32, 34, 36, 38, 40, 42, 44, 46, 48.
The minimum is set at 20% as anecdotal observations of the past GE results indicate that it is the minimum level of support of a side.
Winning at least 50% of the vote in each SMC will translate to the party being awarded a parliamentary seat which is shown in the right chart.
We can immediately observe an intuitive characteristic of the FPTP system is that the popular vote of 34% for the Alternative Party does not translate to seats obtained for it. Vice-versa for the Incumbent with a proportion of seats greater than its popular vote share.
1. All SMCs
Now let’s try see how the vote shifts affects an all-SMC scenario.
| Incumbent | Alternative | |
|---|---|---|
| Seat Share | 1 | 2 |
| Popular Vote | 3 | 4 |
- “Start Simulation” to observe how the incumbent slowly loses its seats to the alternative.
- “Reset button” sets the situation back to the original state.
- “Randomise Data” randomises the initial vote share of the Alternative Party between 12.5% and 49.9%. Please “Reset” before using this.
- The slider allows manual adjustment of the vote swing in 0.1% steps.
As the voting trends shift, we observe alternative candidates are being elected in incrementally in areas with relatively stronger pockets of alternative support.
In the best-minimum penultimate election before the alternative takeover, the alternative will hold 7 seats vs incumbent 8 seats. 0.5 more seat is required to cross the winning margin of 7.5.
The Alternative party should be experienced enough by now to run the government given that they have ran so many town councils therefore the impact of its takeover (7.5 - 7.0)/15 * 100 = 3.33 impact units.
In the penultimate election before the takeover, the Alternative party won 48%. At the tipping point, they got 50.0% with a difference of exactly 2%, the vote gap between SMCs.
Risk of all SMCs = 3.33 * 2 = 6.66 units.
2. 3-member GRCs
Now we bring GRCs onto the table. For the purpose of this scenario, I’ll use 3-member GRCs in the following grouping:
- GRC A: SMC1, SMC2, SMC3
- GRC B: SMC4, SMC5, SMC6
- GRC C: SMC7, SMC8, SMC9
- GRC D: SMC10, SMC11, SMC12
- GRC E: SMC13, SMC14, SMC15
| Incumbent | Alternative | |
|---|---|---|
| GRC A | 1 | 2 |
| GRC B | 3 | 4 |
| GRC C | 1 | 2 |
| GRC D | 3 | 4 |
| GRC E | 3 | 4 |
| Seat Share | 1 | 2 |
| Popular Vote | 3 | 4 |
If I’m the Incumbent trying to gerrymander, I may opt to group the strong SMCs with the weaker ones to dilute the latter’s voting strength but I shall not do this here for scenario simplicity.
The first thing we notice in this simulation is that seats allocated to the Alternative Party are elected in at a slower rate. When they are, 3 seats go at one shot which is reflective of the entire GRC falling at once.
In the best-minimum penultimate election before the alternative takeover, the alternative will hold 6 seats (2 GRCs) vs the incumbent 9 seats (3 GRCs) at a minimum vote share of 44%. The impact is thus (7.5 - 6) / 15 * 100 = 10 impact units.
At the tipping point of 50%, the Alternative has a difference of 6% from the previous vote share.
Risk of 3-member GRCs = 10 * 6 = 60 units. We can see just the introduction of 3-member GRC has almost an order of magnitude more risk!
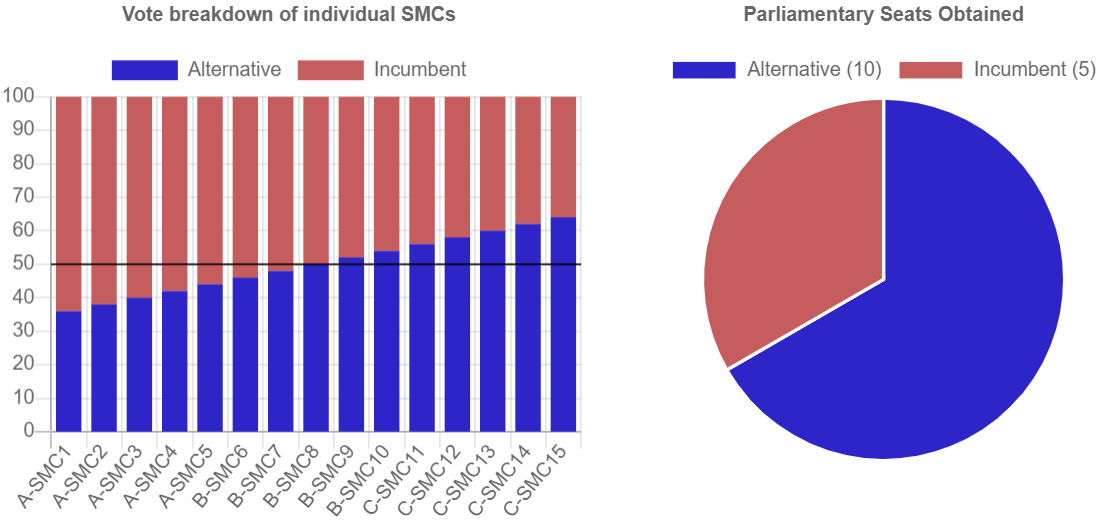
3. 5-member GRCs
What about the effect of larger GRCs? Let’s try the following grouping.
- GRC A: SMC1, SMC2, SMC3, SMC4, SMC5
- GRC B: SMC6, SMC7, SMC8, SMC9, SMC10
- GRC C: SMC11, SMC12, SMC13, SMC14, SMC15
| Incumbent | Alternative | |
|---|---|---|
| GRC A | 1 | 2 |
| GRC B | 3 | 4 |
| GRC C | 1 | 2 |
| Seat Share | 1 | 2 |
| Popular Vote | 3 | 4 |
In the best-minimum penultimate election before the alternative takeover, the alternative will hold 5 seats (1 GRC) vs the incumbent 10 seats (2 GRCs) at a minimum vote share of 40%. The impact is thus (7.5 - 5) / 15 * 100 = 16.7 impact units.
At the tipping point of 50%, there is a difference of 10% from the previous vote share.
Risk of 5-member GRCs = 16.7 * 10 = 167 units. Almost triple the risk of 3-member GRCs!
4. Singapore as an entire GRC
| Incumbent | Alternative | |
|---|---|---|
| Singapore GRC | 1 | 2 |
| Seat Share | 1 | 2 |
| Popular Vote | 3 | 4 |
Let’s push things to the logical extreme where all the SMCs (meaning the entire Singapore) falls under a single GRC. It’s an all-or-nothing game where the winning party grabs all the seats with the losing party getting nothing.
In the best-minimum penultimate election before the alternative takeover, the alternative will hold 0 seats (0 GRC) vs the incumbent 15 seats (1 GRC) at a minimum vote share of 34%. The impact is thus (7.5 - 0) / 15 * 100 = 50 impact units.
At the tipping point of 50%, there is a difference of 16% from the previous vote share.
Risk of the entire SG GRC = 50 * 16 = 800 units!!!
Conclusion
It can be seen in this example country, the larger the GRCs employed, the higher risk of that of a Freak Election.
Keeping in consideration the official reasons of having GRCs which is to ensure minority representation in Parliament, we should place equal consideration on the implementation of the GRC system and weigh the tradeoffs of the possible repercussions.
If you are curious, the animated charts used were created using Chart.js. Many thanks to my talented web frontend friend Hui Jing for helping me to debug my animated charts too!